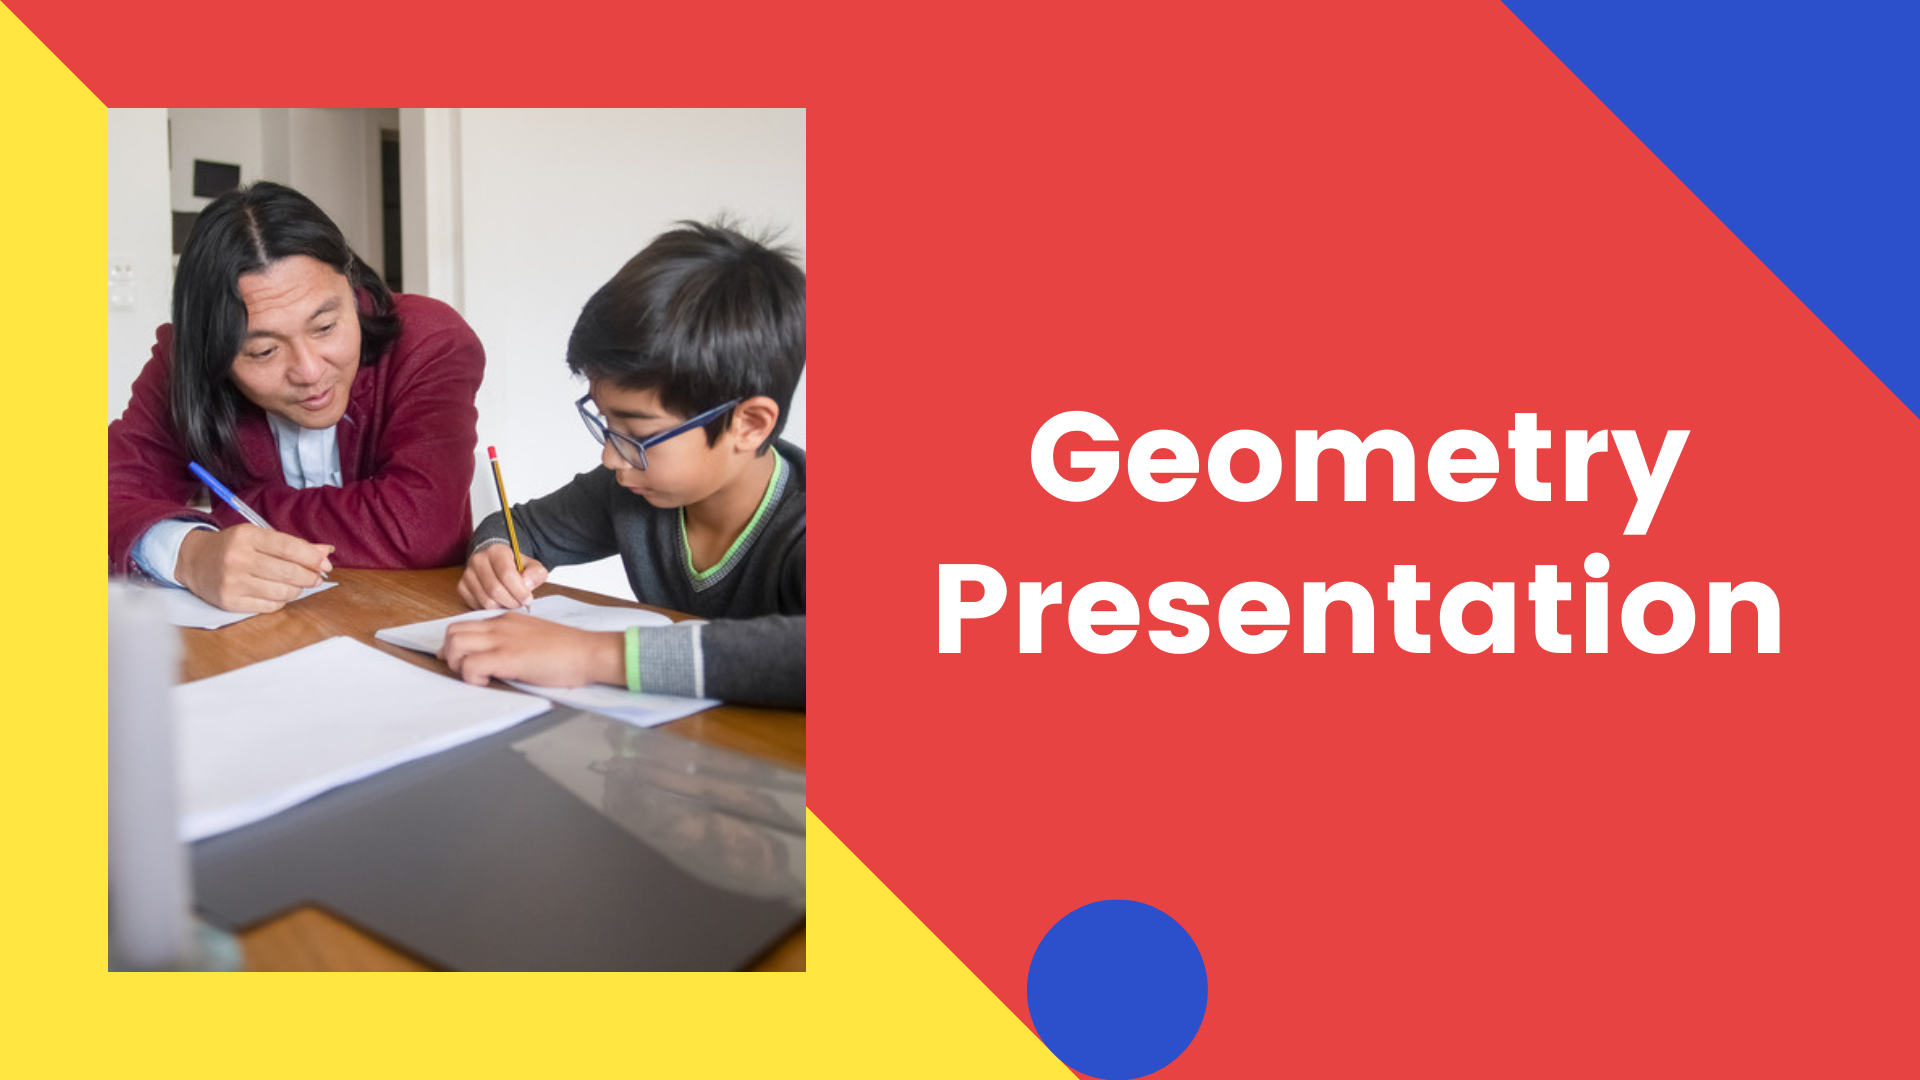

In primary colors, this blue, yellow and red Geometry Math template nearly jumps out of the screen and comes to life. Fill it with your best lesson plan ideas and find plenty of space for charts and graphs, statistical figures and geometry problems. The icon and element resource pages near the end of the deck are packed with geometry-themed shapes, which you can use throughout the template. Upload your own images, photos and illustrations or find what you need in our library. Wondering how to use these slides in PowerPoint, Google Slides or Canva? Check out the instructional slide at the start of the deck.

 Features of this template
- 조직도 파워포인트 템플릿으로 조직 전략을 돋보이게 만드세요.
- 바 차트 테마의 프레젠테이션에 대해, 다양한 색상의 바 그래프, 데이터 시각화 아이콘, 애니메이션 차트 전환 및 관련 통계와 같은 요소를 삽입할 수 있습니다.
- 16:19 화면 레이아웃 (클릭 한 번으로 4:3으로 변경 가능)
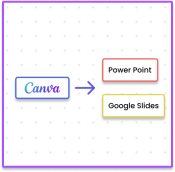
- PowerPoint이나 Google 슬라이드와 쉽게 사용할 수 있습니다.
Canva에서 더 많은 기능을 이용하세요:
- 이 수학 수업 계획 템플릿에는:
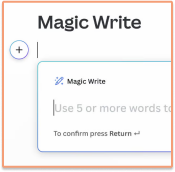
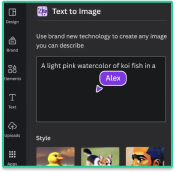
- 수백 가지의 고유한 아이콘과 요소 중에서 선택할 수 있습니다.
- 친구나 가족과 디자인하는 협업 기능
- 검색 가능한 사진, 이미지, 글꼴, 비디오 및 사운드트랙
- 라이브러리에서 선택할 수 있는 수백만 개의 멋진 무료 이미지
- 이 Geometry Math 템플릿에는 다음이 포함되어 있습니다: