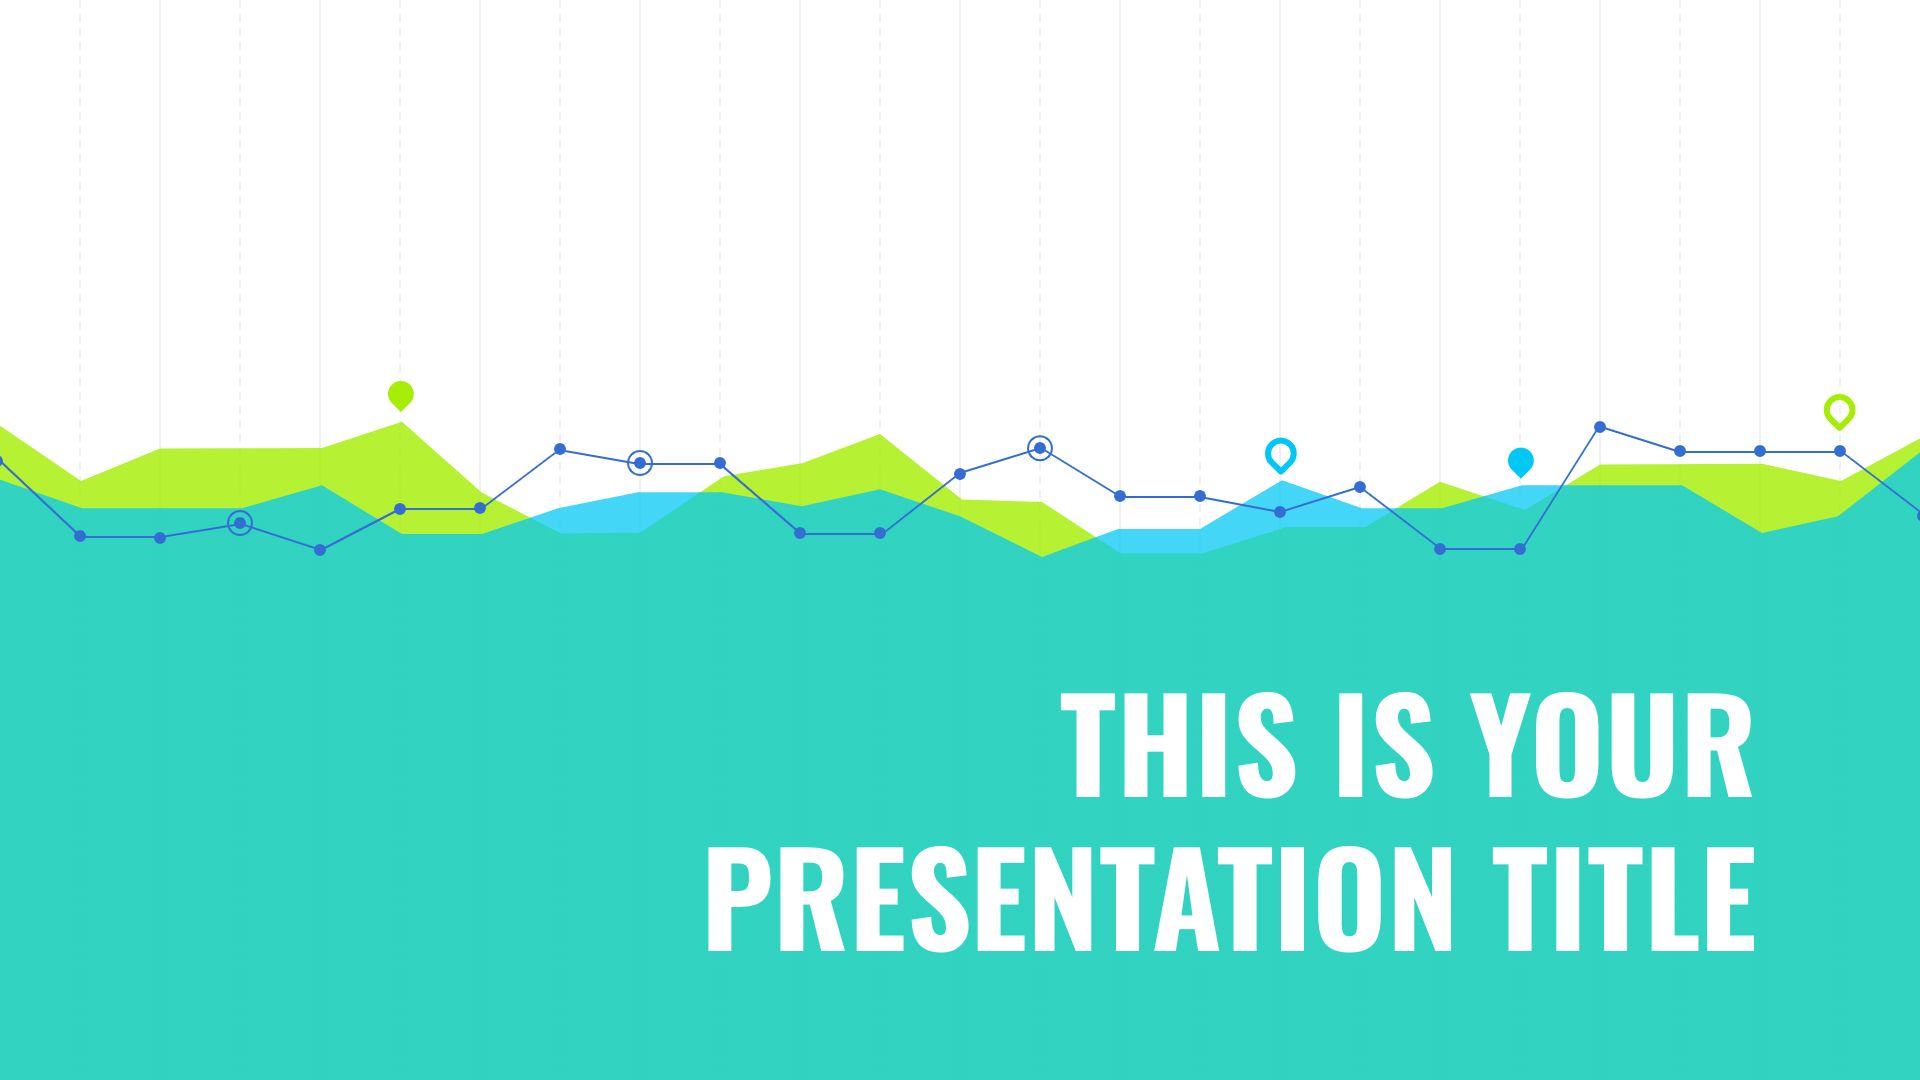

This template is specifically designed for presenting data results or statistics. The background visual mimics a line graph, and all assets are editable so you can change the colors of the background charts to suit your brand. Use this free presentation template to communicate your campaign data and final analysis, statistical reports, or other performance information of your company.

 Features of this template
- 완전히 편집 가능합니다. 색상, 텍스트 및 사진을 쉽게 변경할 수 있습니다.
- 프레젠테이션을 개선하기 위한 팁이 담긴 25가지 슬라이드. 간트 차트 슬라이드쇼 프레젠테이션에 더 관련성을 높이기 위해 어떤 요소나 객체를 삽입할 수 있을까요? 당신의 필요에 따라 슬라이드 페이지를 추가, 삭제 또는 재정렬하세요.
- 그래프 배경과 생동감 있는 색상의 데이터 테마 디자인
- 조직도 슬라이드쇼 프레젠테이션에 더 관련성을 높이기 위해 어떤 요소나 객체를 삽입할 수 있을까요?
- 크기와 색상을 변경할 수 있는 80가지 다양한 아이콘과 세계지도가 포함되어 있습니다. 이 모의 테스트 파워포인트 템플릿은 제 프레젠테이션을 어떻게 향상시킬 수 있을까요?
- Google 슬라이드 테마로 사용하거나 컴퓨터에서 PowerPoint 템플릿으로 다운로드하여 편집
- 16:9 화면 레이아웃 (클릭 한 번으로 4:3으로 변경 가능하지만 일부 그래픽 자산이 잘 작동하지 않을 수 있음)