Data visualization — a.k.a “Dataviz” — has made its way into our daily lives and can be spotted all around us. Whether on the billboard advert you pass on your commute home, or in a government brief outlining the spread (and slowing!) of coronavirus across the globe, communicating through data has become the worldwide status quo.
And, as the power and influence of data increases, professionals of all levels are looking to learn that bit more about dataviz. In this guide, we’ll look at 6 design tips on how to show data in your presentations — to highlight important trends, get your audience onboard with your message, and communicate on a more emotional level.
- First up: what is data visualization actually?
- What is data storytelling in presentations?
- 6 tips to improve data storytelling in your presentation
- Tip #1: Use the right chart
- Tip #2: Check for legibility
- Tip #3: Keep it simple
- Tip #4: Highlight what matters
- Tip #5: Don’t use defaults: customize!
- Tip #6: Make it accessible
- Ready to be a dataviz whizz?
First up: what is data visualization actually?
Put simply, data visualization is the visual representation of information, using things like charts and tables, with shapes, color and graphics to represent data findings.
Basically, it’s anything that communicates the point of data findings in a visual way.
Data visualization does a great job of:
- Providing context
- Strengthening the persuasiveness of your claims
- Making key insights more memorable
- Prompting intuition from the audience
Yet, the real magic happens when data visualization is mixed with great storytelling.
What is data storytelling in presentations?
Knowing how to develop and deliver a data-driven presentation is now a crucial skill for many professionals.
No longer is it enough to just say something — we need statistics, numbers and quantitative evidence to confirm the legitimacy of claims and make them mean something.
The sheer amount of data we need to sift through in our lives is overwhelming. It’s hard — and not to mention, time-consuming — to spot patterns in a long list of numbers on a spreadsheet.
This is why we need visually compelling charts in unit meetings, sales presentations, customer research reports and pitch decks. But still, sometimes even that’s not enough.
Although they might look pretty, a good data storyteller isn’t the one who slaps bar chart after bar chart on their pitch, or spends hours designing data graphics.
They’re the one who considers their audience before any visuals are rendered.
When you create a chart or a piece of data visualization, you need to ask yourself:
- Will my audience understand this?
- Is it effective in teaching them something new?
After all, effectively communicating your message with an audience is the bread and butter of a presentation. So to answer those questions positively, it’s worth taking note of the following…
6 tips to improve data storytelling in your presentation
Tip #1: Use the right chart
We’re all familiar with the humble pie or bar chart. These are by far the most commonly-used graphs in presentations, as they are versatile and easy to understand.
However, that doesn’t always make them the right choice. Often they are too simplistic for complex data, which skews the audience’s understanding and threatens to knock you off-course on your hunt for the perfect presentation.
So what type of graph or chart do you want? Well, that largely depends on what you’re aiming to do — or, what your ‘data visualization goal’ is.
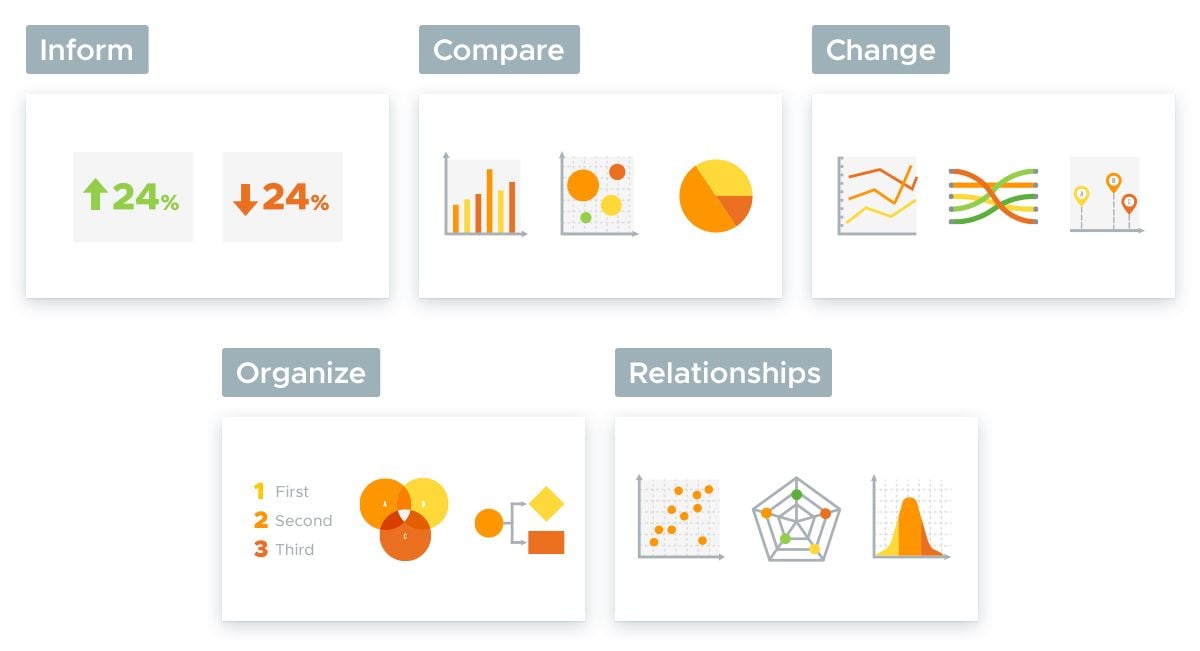
If you want to…
- Inform (convey a single data point that’s easy to understand, with minimal context), then use a single large-scale number, with simple symbols or icons to emphasize growth, decline, etc.
- Compare (show similarities or differences among values), use a bar chart or bubble chart. If it’s to compare parts of a whole, a pie chart or a stacked bar chart are the best options.
- Show change (visualize trends in time or space), use a line chart, a timeline infographic or alluvial diagram for time. To visualize trends in space, a choropleth map is the best bet.
- Organize (show groups, patterns, rank or order), use numbered lists, Venn diagrams, mind maps, or flow charts.
- Reveal relationships (show correlations among variables or values), use scatter plots, radars, matrixes, or a histogram.
And you can always check Dr. Abela’s Chart Chooser if you need more help on which chart to use.
Tip #2: Check for legibility
This may sound obvious, but sometimes what’s readable to you, on your laptop screen, may require the person in the back row of your audience to really squint their eyes — especially if they’re contending with a broken set of blinds and sunlight streaming in!
To avoid the hasty hunt for the projector’s brightness button, use big fonts and primary, accessible colors so viewers can get the gist of the graph. Even from the back of the room.
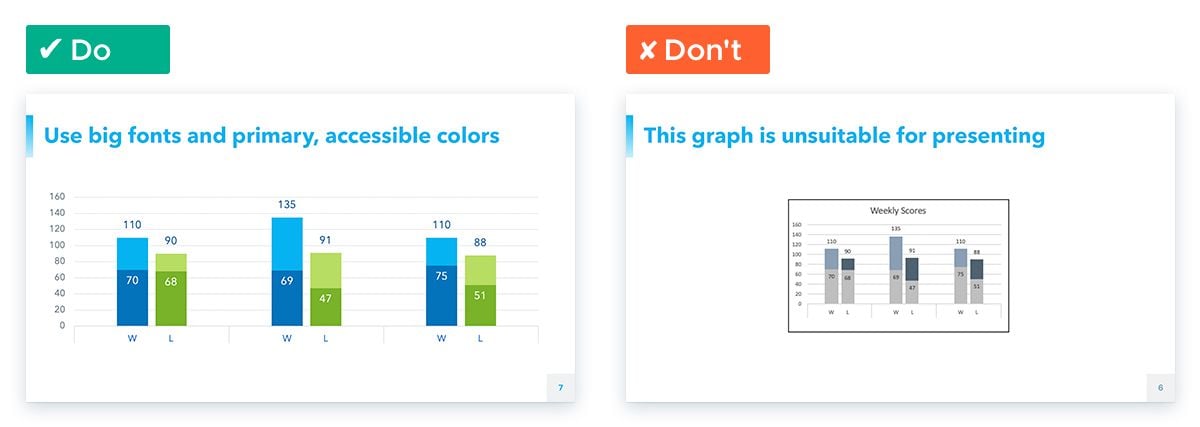
This is especially important if you’re using graphs copied from journals or the internet, as they are often pixelated, unreadable and blurry when projected onto the big screen.
To save yourself from an uncomfortable-looking audience, find a comparable, legible graph, or create a new graph showing the same data in a PowerPoint-friendly format.
Tip #3: Keep it simple
As the old saying goes: less is more. And that’s certainly true in data storytelling.
Minimalism in chart design is key to achieving a sophisticated look, while allowing your data to be the star of the show.
Remember, you may have been working with the same chart for weeks or months, but your audience only sees it for a few seconds. To give them the best chance of comprehending your data, and use a clear, simple design.
Borders, gridlines, background colors, and other extra decorations should take a backseat to the points, bars, or lines that actually represent the data.
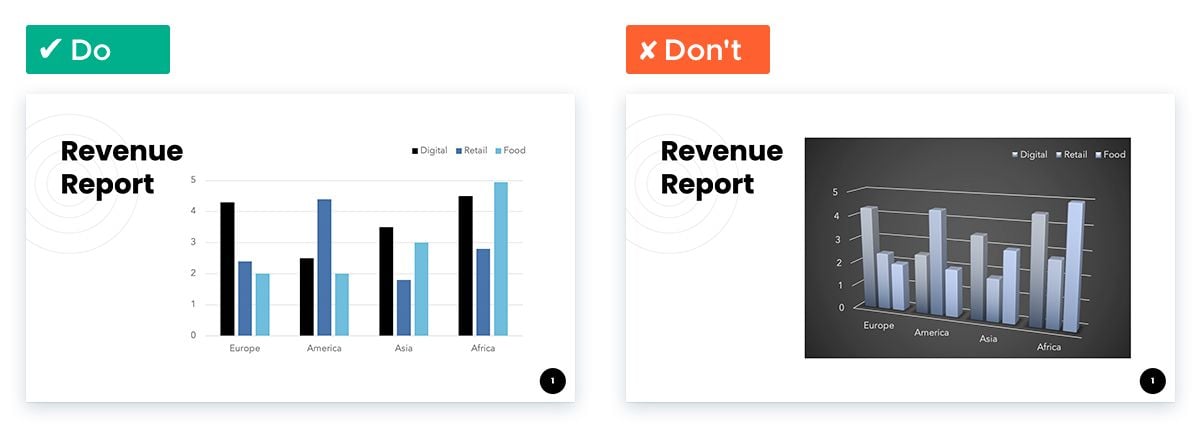
Here’s a few hacks to help you out:
- Lighten or remove gridlines
- Avoid borders and outlines, remove backgrounds
- Get rid of 3D, shades and other ‘special’ effects
- Use color for function, not decoration — don’t use more than six colors
Tip #4: Highlight what matters
Every chart has a number or range of data that reveals something crucial to your point, so drawing the audience’s attention to that piece of data is vital in maintaining their engagement.
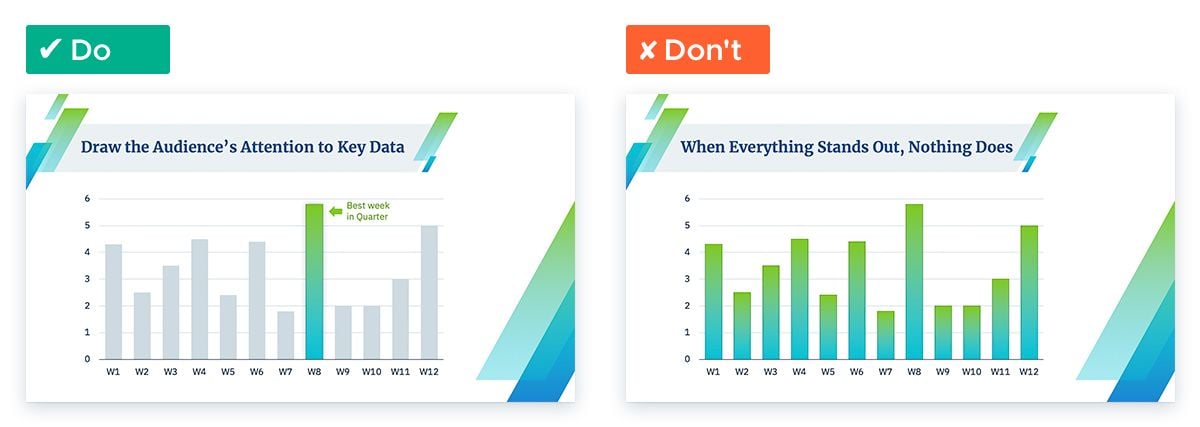
- Go monochrome with a highlight: pick two complementary but distinct colors and give your most important piece of data the highlight color
- Guide the eyes: use lines, arrows or circle marks to physically point out the key data sets
- Fade out unimportant data: choose one key color to distinguish more important values and use gray for the data that you want to be less of a focus
- Animate important segments or bars, a good visual can become awesome if you add some animation and interactivity
Tip #5: Don’t use defaults: customize!
Most audience members can spot a PowerPoint, Keynote or Excel default color theme from a mile off. And what does that say about your presentation? Leaning too heavily on default styles suggests you’ve not taken the time to really consider your data visualization.
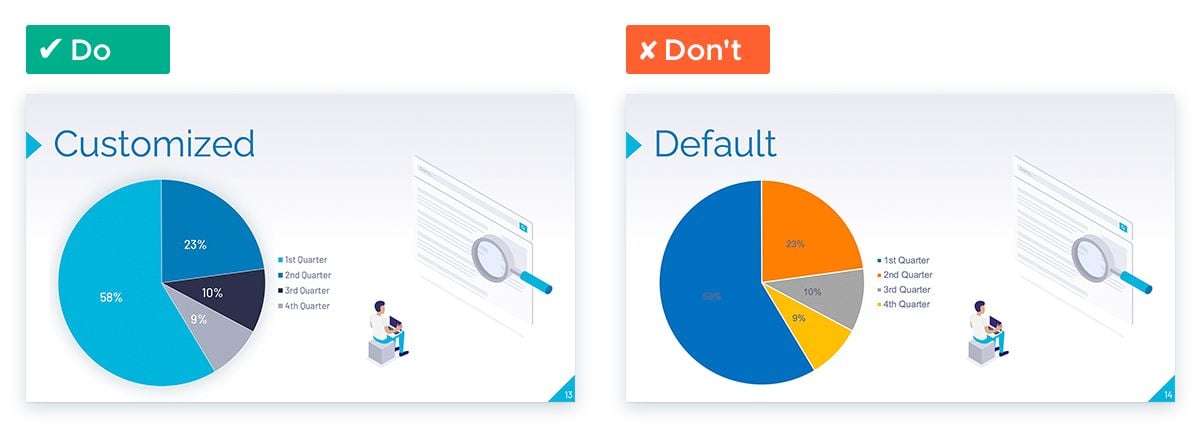
To maintain the professionalism of your presentation, steer away from that ‘default’ look and redesign your charts to match your presentation’s colors and style.
Not only will it suggest you’ve put in ample effort, but it will intrigue an audience and make them more likely to listen to what this style-savvy, professional presenter has to say.
Tip #6: Make it accessible
Did you know that approximately 1 in 12 men (8%) and 1 in 200 women (0.5%) are affected by color blindness? So it’s highly likely at least one person in your audience has some level of color deficiency.
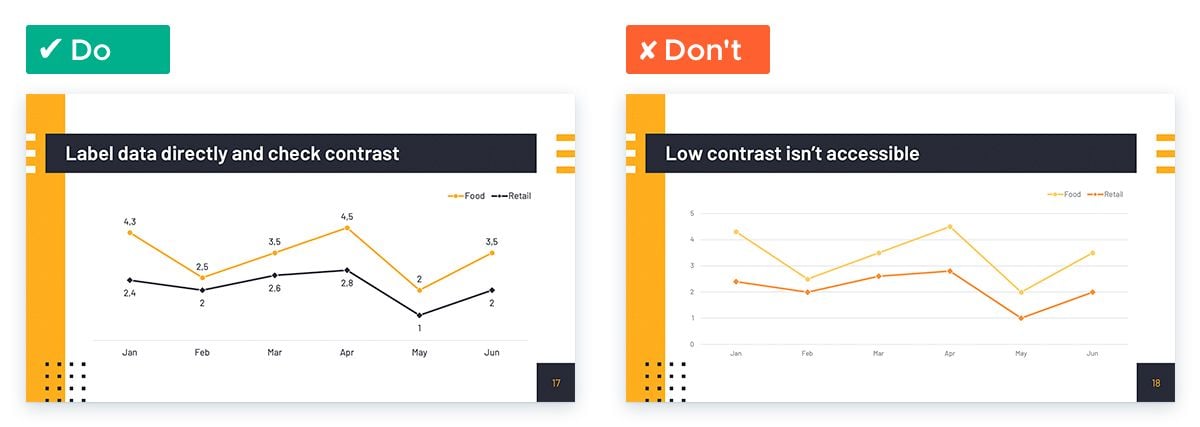
To ensure your presentation is accessible (and visible!) to all, make sure you:
- Label data directly
- Check type and color contrast to make sure the content is readable
- Use white space to distinguish between different sections
Ready to be a dataviz whizz?
When all is said and done, there’s no reason why math and storytelling shouldn’t mix.
By having that all important awareness of your audience, and creating the perfect data visualization design, you’ll no doubt leave a lasting impression on those fortunate enough to hear what you have to say.
Looking for more presentation inspiration?
At SlidesCarnival, we have a huge library of free presentation templates that you can download, edit, and customize. Browse the collection to discover great design ideas that are sure to make your presentation stand out.
